AUSTIN, TX—During the second quarter, Summit Hotel Properties Inc. saw sequential improvement in occupancy and RevPAR levels driven mostly by weekend leisure demand outside of core urban markets.
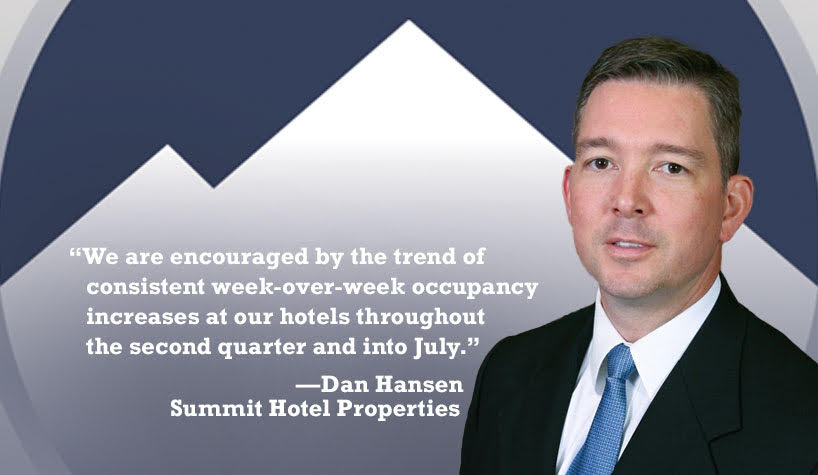
“The second quarter was extraordinarily challenging for the industry as demand deteriorated to historically low levels and the typical booking window shortened considerably,” said Dan Hansen, Summit’s chairman, president and CEO. “Yet, we are encouraged by the trend of consistent week-over-week occupancy increases at our hotels throughout the second quarter and into July.”
Summit’s RevPAR declined 83% during the second quarter, but improved sequentially each week throughout the quarter as June RevPAR declined 75%, compared to the nearly 90% decline it saw in April. When excluding the 15 hotels that were closed at various times during the quarter, occupancy was approximately 46%.
“Occupancy was over 41% across the total portfolio in July, nearly 30 full percentage points higher than the first two weeks of April when demand troughed, and our preliminary July results point to a 67% year over year decline,” Hansen said.
In addition to the increase in occupancy, market share gains were substantial in the quarter, according to Hansen. “We finished with a 143% RevPAR index, more than 20 percentage points higher than the first quarter and nearly 30 percentage points higher than the same period in 2019,” he said.
“Weekends began to perform much better than weekdays as the quarter progressed, driven by a relaxation of the mandatory stay-at home orders, resulting in an increase in leisure travel, particularly in drive-to markets,” he added. “In June, weekend occupancy exceeded weekdays by nearly 10 full percentage points, averaging over 41% occupancy for the month and resulting in a 30% premium to our weekday RevPAR. Weekend occupancy at our hotels located in markets we considered as drive-to surpassed 50% in June, and this trend has accelerated as these hotels achieved 58% occupancy during the weekends for the month of July.”
Hansen noted that extended-stay hotels, which comprise nearly a quarter of Summit’s total guestrooms, were “relative outperformers during the second quarter, finishing with 38% occupancy and a 76% RevPAR premium to our overall portfolio. Our extended-stay hotels posted an average occupancy of approximately 48% in June and our preliminary July results indicate our extended-stay hotels achieved 60% occupancy for the month.”
Suburban and airport hotels, which comprise more than a third of Summit’s portfolio, also fared well. They posted occupancies of 37% and 35% respectively, also driving a premium to the total portfolio, Hansen said.
“Urban hotels have been the laggard for the industry in the recovery, though we are beginning to see signs of improvement as July occupancy finished nearly 1,000 basis points higher than in June for our urban portfolio, the largest single month over month gain since the onset of the crisis,” he added.
While many in the industry saw disruption in July due to the spike in COVID-19 cases in various markets across the country, Jonathan Stanner, EVP, CFO and treasurer noted that Summit didn’t really see a pullback. “We have seen a sequential demand increase every week since the middle of March, which is encouraging,” he said. “We have seen the rate of growth and the rate of improvement slow as we got into July.”
Stanner attributed this to a resurgence in COVID-19 cases, particularly in the Sun Belt, as well as the reopening of more hotels, particularly in the full-service space. This created new supply that absorbed some incremental demand.
Hansen noted that the hotels are operating on lean staffing models, averaging 10 full-time employees per hotel as compared to roughly 30 full-time employees per hotel prior to the pandemic.
“To preserve liquidity, we have continued to delay all nonessential capital expenditures for the remainder of 2020 along with common dividend distributions, which, combined, preserved nearly $30 million in the second quarter and will preserve $60 million of cash for the balance of the year,” Hansen said. “With approximately $270 million of current liquidity and a significantly reduced monthly cash burn rate, we currently have over three years of liquidity to navigate what could be a prolonged recovery.”
Stanner added, “The efforts our asset management team made to mitigate the sudden demand shock that began in the middle of March, including right sizing staffing levels and adjusting service and amenity offerings, resulted in strong retention of just over 40% in the second quarter. This has reduced our monthly cash burn rate from between $10 million to $12 million per month to approximately $7.5 million for the month of June and closer to $7 million in July. At these levels, our projected liquidity runway has increased to approximately 38 months, adding over a full year of runway since we reported first quarter results.”
Stanner added that the portfolio’s breakeven RevPAR at the hotel level is between $35-40. “We nearly met the low end of this range in June and exceeded the high end of this range in July,” he said.
Second Quarter 2020 Summary
- Net Income: Net loss attributable to common stockholders was $54.1 million, or ($0.52) per diluted share, compared with net income of $45.2 million, or $0.43 per diluted share, in the same period of 2019.
- Pro Forma RevPAR: Pro forma RevPAR decreased 83% to $23.20 from the same period in 2019. Pro forma ADR decreased 42.5% to $95.57 compared to the same period in 2019, and pro forma occupancy decreased 70.5% to 24.3%.
- Same-Store RevPAR: Same-store RevPAR decreased 83.3% to $22.44 from the same period in 2019. Same-store ADR decreased 42.6 percent to $94.30 compared to the same period in 2019, and same-store occupancy decreased 70.9 percent to 23.8 percent.
- Pro Forma Hotel EBITDA: Pro forma hotel EBITDA was ($10.0) million compared to $60.9 million in the same period in 2019.
- Adjusted EBITDAre: Adjusted EBITDAre was ($12.8) million compared to $52.4 million in the same period of 2019.
- Adjusted FFO: AFFO was ($25.9) million, or ($0.25) per diluted share, compared to $38.6 million, or $0.37 per diluted share, in the same period of 2019.
Stanner noted that, like the rest of the industry, demand has primarily been driven by leisure travel. “Like many, we are cautious about backfilling that demand in the fall and winter months this year that are naturally less conducive to personal travel,” he said. “Our expectations for a meaningful return of corporate travel have been pushed back, and while we would not preclude a pickup from today’s low levels and the sporadic nature of demand, our working assumption is for the rate of improvement we saw throughout the summer months to slow and the passage of time, a medical solution to the virus or a combination of both will ultimately lead to more robust levels of travel.”
However, he said, while there’s been much conjecture about new normals—particularly declines in business travel on a more sustained basis coming out of the crisis—Summit is optimistic. “While we clearly do not have a crystal ball, we remain long-term believers in people’s innate desire to gather, enjoy the experiential side of life and ultimately travel, and we believe our diversified portfolio of well located hotels with efficient operating models is poised to be an outperformer going forward,” he said.
Hansen added that while it’s a little early for “the tactical execution of acquisitions and dispositions,” Summit “would like to be in a position to take advantage of opportunities as they come up.”
He added, “We’re certainly not opposed to selling assets for the right price and the right market. We like our portfolio today…so nothing currently, but certainly we remain patient and interested.”